A couple of weeks ago some friends and I have participated in a three day programming competition (Hackathon) centered around data mining and machine learning. We won third place and self gratification.
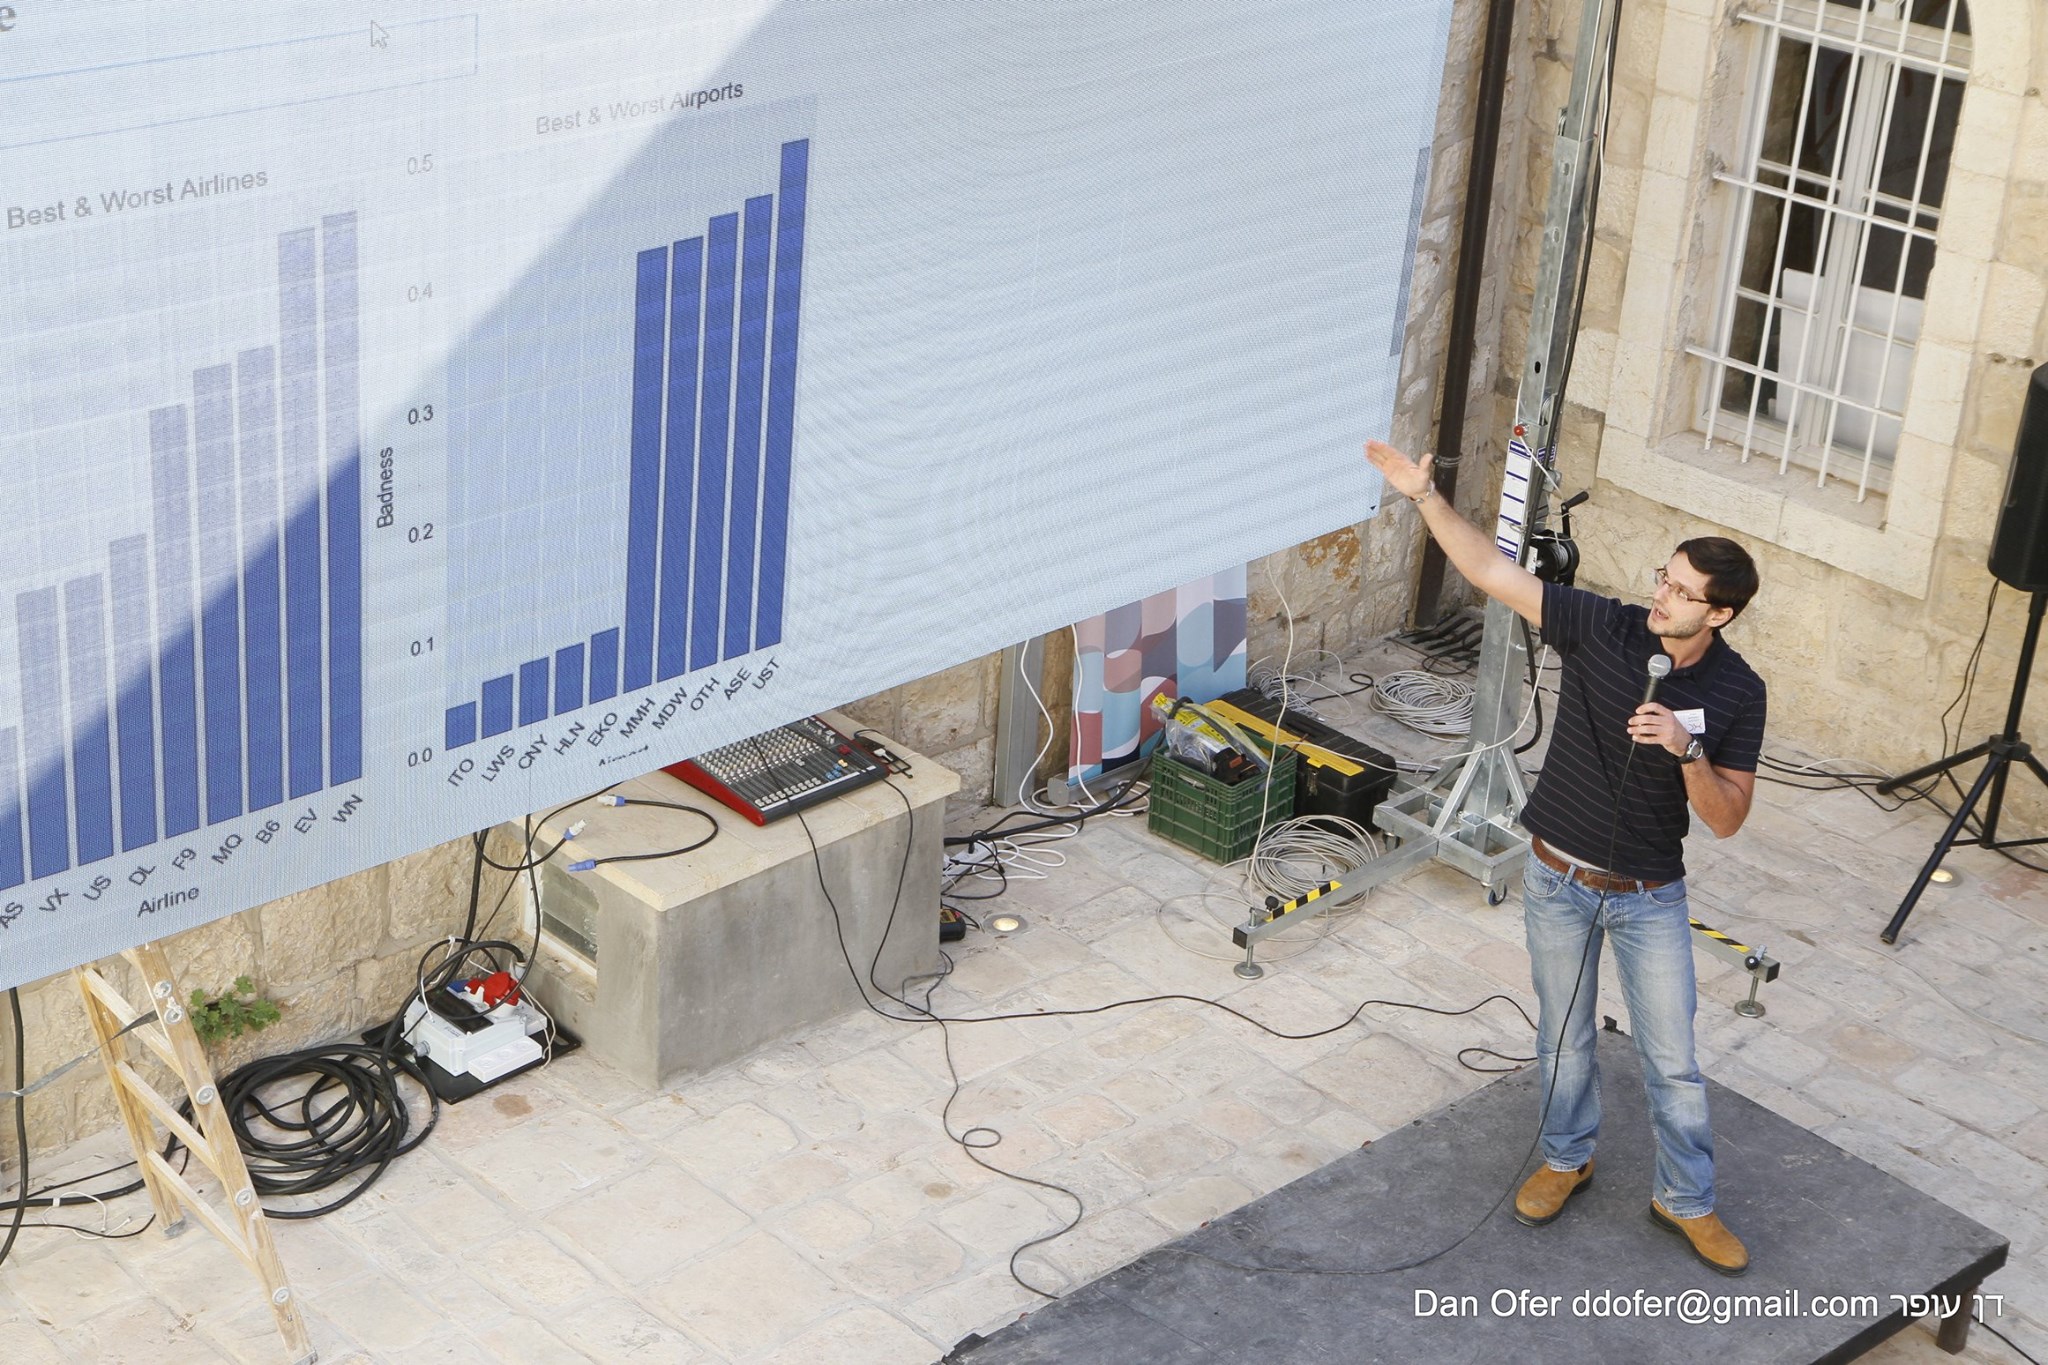
Presenting FlyCatcher

FlyCatcher Team
Bellow is a summary of what we did – Caution, technical stuff 🙂
Using historical data about flights, weather and machine learning we are able to predict if a flight will be delayed a day prior to its’ schedule.
We find novel insights relating historical flight delays to future flight delays.
In particular, previous day delays in the airport and airline are found to contain high predictive power for next day flight delays, resulting in 77.6% accuracy of prediction.
Also, tracking flights of distinct airplanes results in 90% predictive accuracy of delays.
We looked at 10 years of flight and weather records.
We downloaded flight data from the USA Bureau of Transportation Statstics. It consisted of 500,000 civilian Inter-American flight details for each month. For weather, we got measurements from all meteorological stations in the US from the National Oceanic and Atmospheric Administration, including all the weather stations that are located within or in close proximity to airports. There was a weather measurement every 2 minutes for each station.
After working and examining the data we decided to focus on all records from 2014.
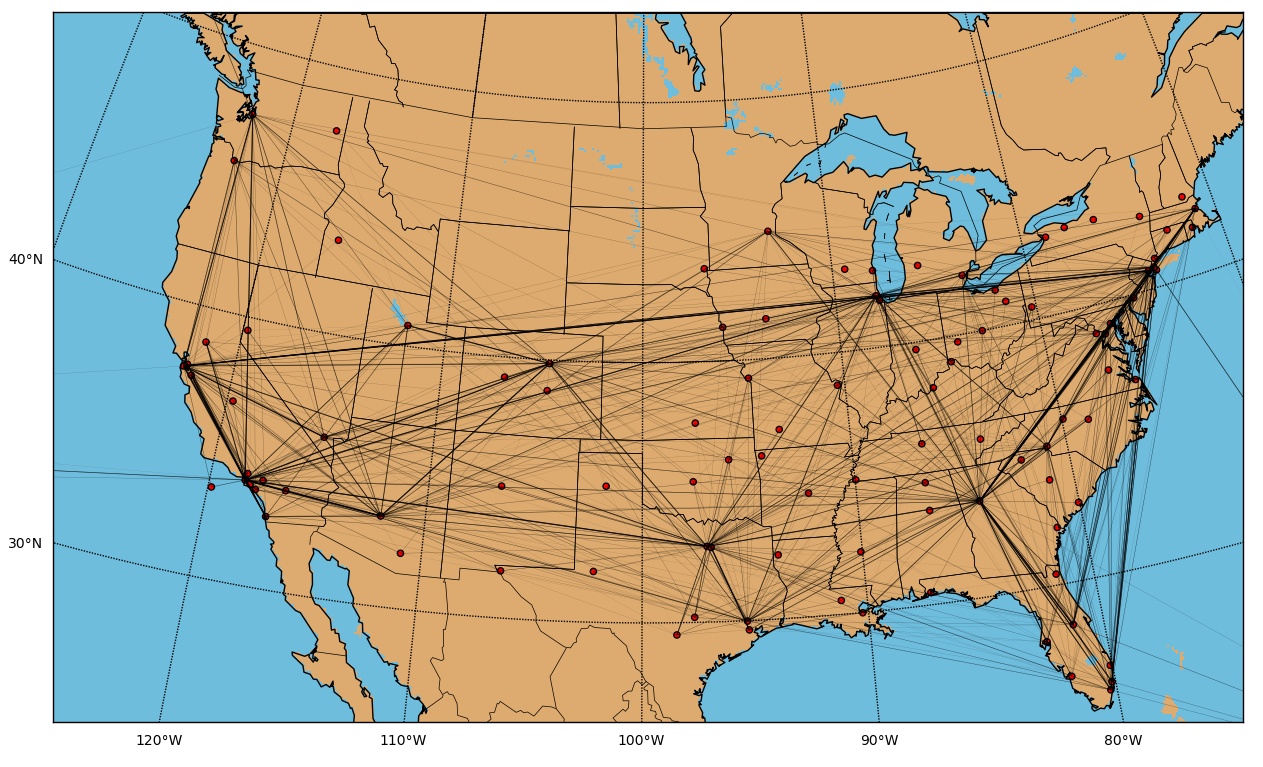
We started off by mapping busy flight lines across America. In the map bellow, the darker lines are those that have more flights going through them.
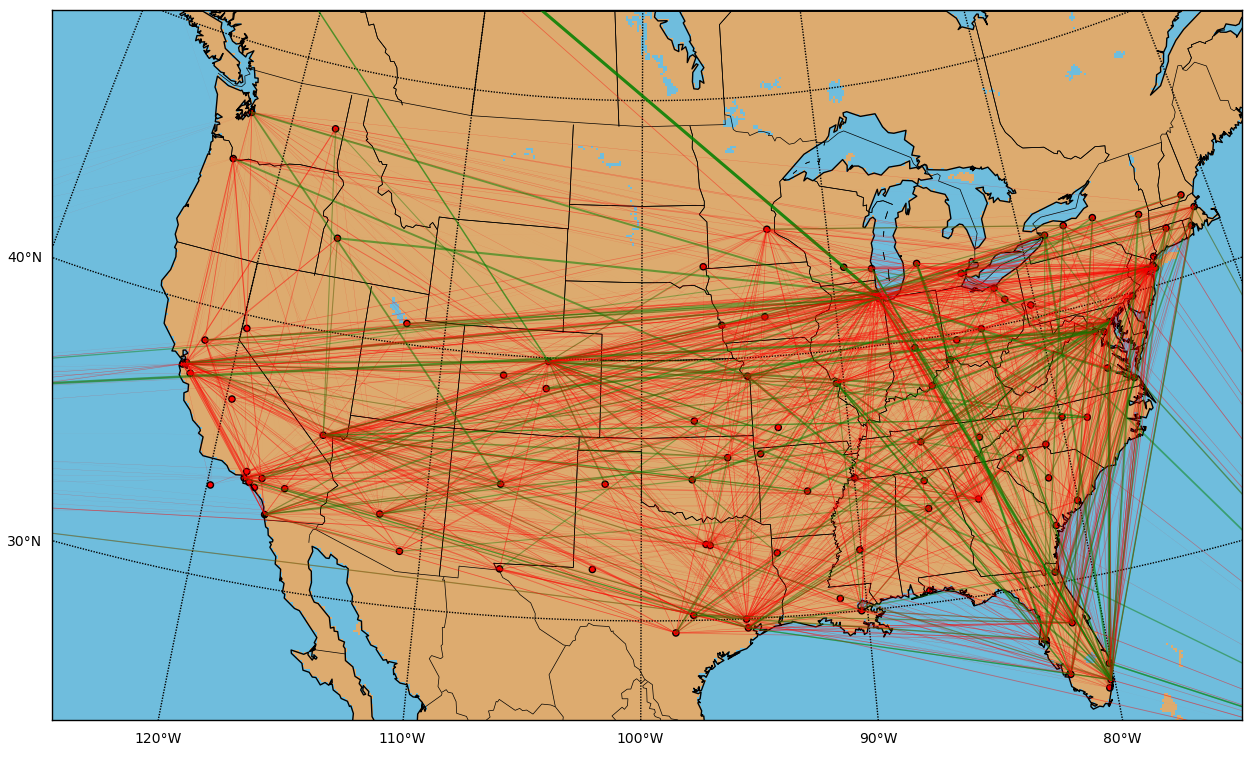
 Next, we were interested to see the spread of flight delays as percentage of total flights on the same route. The Green lines in the map bellow indicate relatively few delays as part of total flights on the same line, the stronger the color the smaller the percentage of delayed flights. Red lines indicate routes with relatively more delays, the stronger the red the larger the portion of delayed flights as part of total flights on the same route.
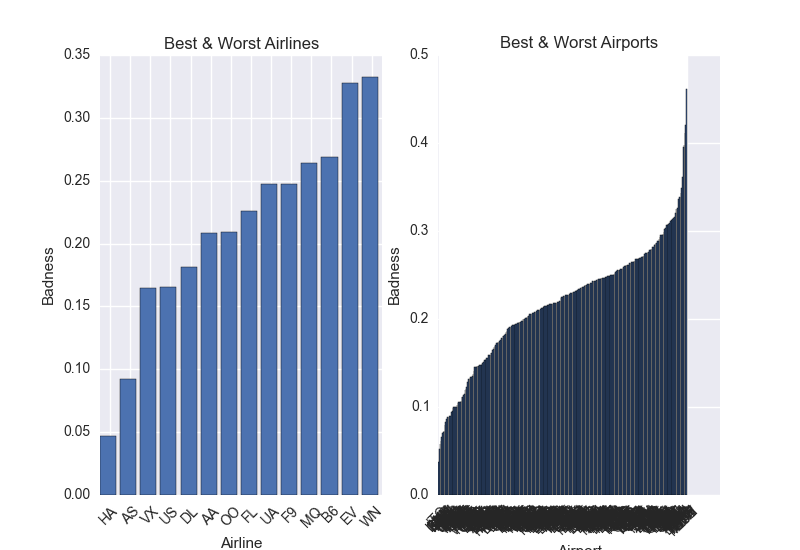
Examining delays across airlines and airports we saw that the busier the airport or the larger the airline, the higher the percentage of their delayed flights as a part of their total flight count.
The graphs bellow show all the 14 major American airlines (left) and the hundreds of airports (right) flight delays percentage of their total respective flight counts in all of 2014.
We can see for example that United Arilines (UA) – a very big company – had a much higher percentage of delayed flights than Hawaiin Airlines (HA) – a much smaller company.
Next, we combined weather and flight data to see if there is any connection between the two. In the graph bellow, green vertical lines indicate days of storms (rain, snow, strong winds) across 2014 in Atlanta airport. The blue line is the percentage of delayed flights in a day across the same time. We see that during storm times there are no characterizing peaks of delays at the same time.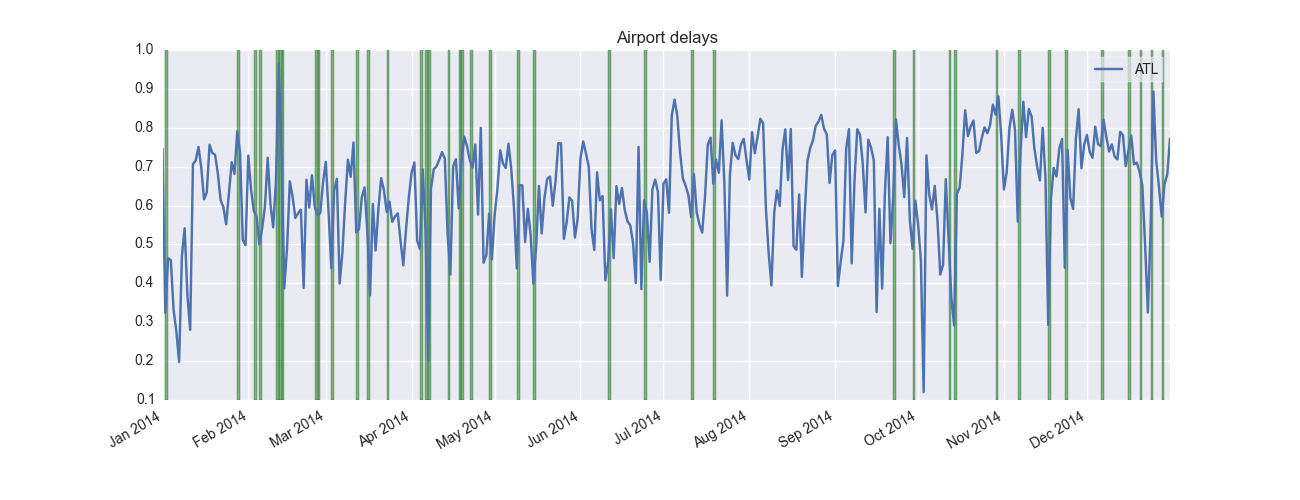 Getting more towards the machine learning phase, after sorting, filtering through and running some basic prediction models, we extracted the following features vector for each flight in 2014:
“FlightNum”,”CRSDepTime”,”DepDelay”,”CRSArrTime”,”ArrDelay”,
“AirTime”,”Distance”,”date”,”crsdeptime”,”crsarrtime”,”CLD”,”OLD”,
“DLD”,”wind_speed”,”clouds_height”,”temperature”,”AU_Intens”,
“AU_Precip”,”wind_direction”,”visibility”,”pressure”,”AW_Atmos_Cond”,
“AU_Obscur”,”AU_Desc”,”Delay”
Some of these are categorical parameters, for example, AU_Precip is a value out of 7 possible that describes the type of weather around (specifically, what type of precipitation is going on – light or heavy rain, snow, no precipitation and more). Some of the parameters were numerical, for example wind_speed which was measured in meters per second.
All temporal predictive parameters, like weather and conditions the day before were measured the day before each flight. Parameter DepDelay indicated of the time of delay, if it was larger than 15 we considered it as a delayed flight.
After filtering out all the records to have all these fields we were left with about 2250000 records. We took all records of the last 3 months of 2014 and used them as a test set and the 9 first months as training.
The three most interesting parameters we found in this feature vector were:
- CLD – Carrier FLight Delays, a measurement of the amount of delays the same airline had the day before.
- OLD – Origin FLight Delays, a measurement of the amount of delays the origin airport had the day before.
- DLD – Destination FLight Delays, a measurement of the amount of delays the destination airport had the day before.
We also found that weather information did not help improve prediction accuracy and in some instances even reduced accuracy.
Our model checked whether we can predict the binary indicator of DepDelay>=15. We used SVM, RandomForest and the simple logistic regression. The best estimation method was the logistic regression and by far the fastest as well. It resulted in the reported 77.6% prediction accuracy.
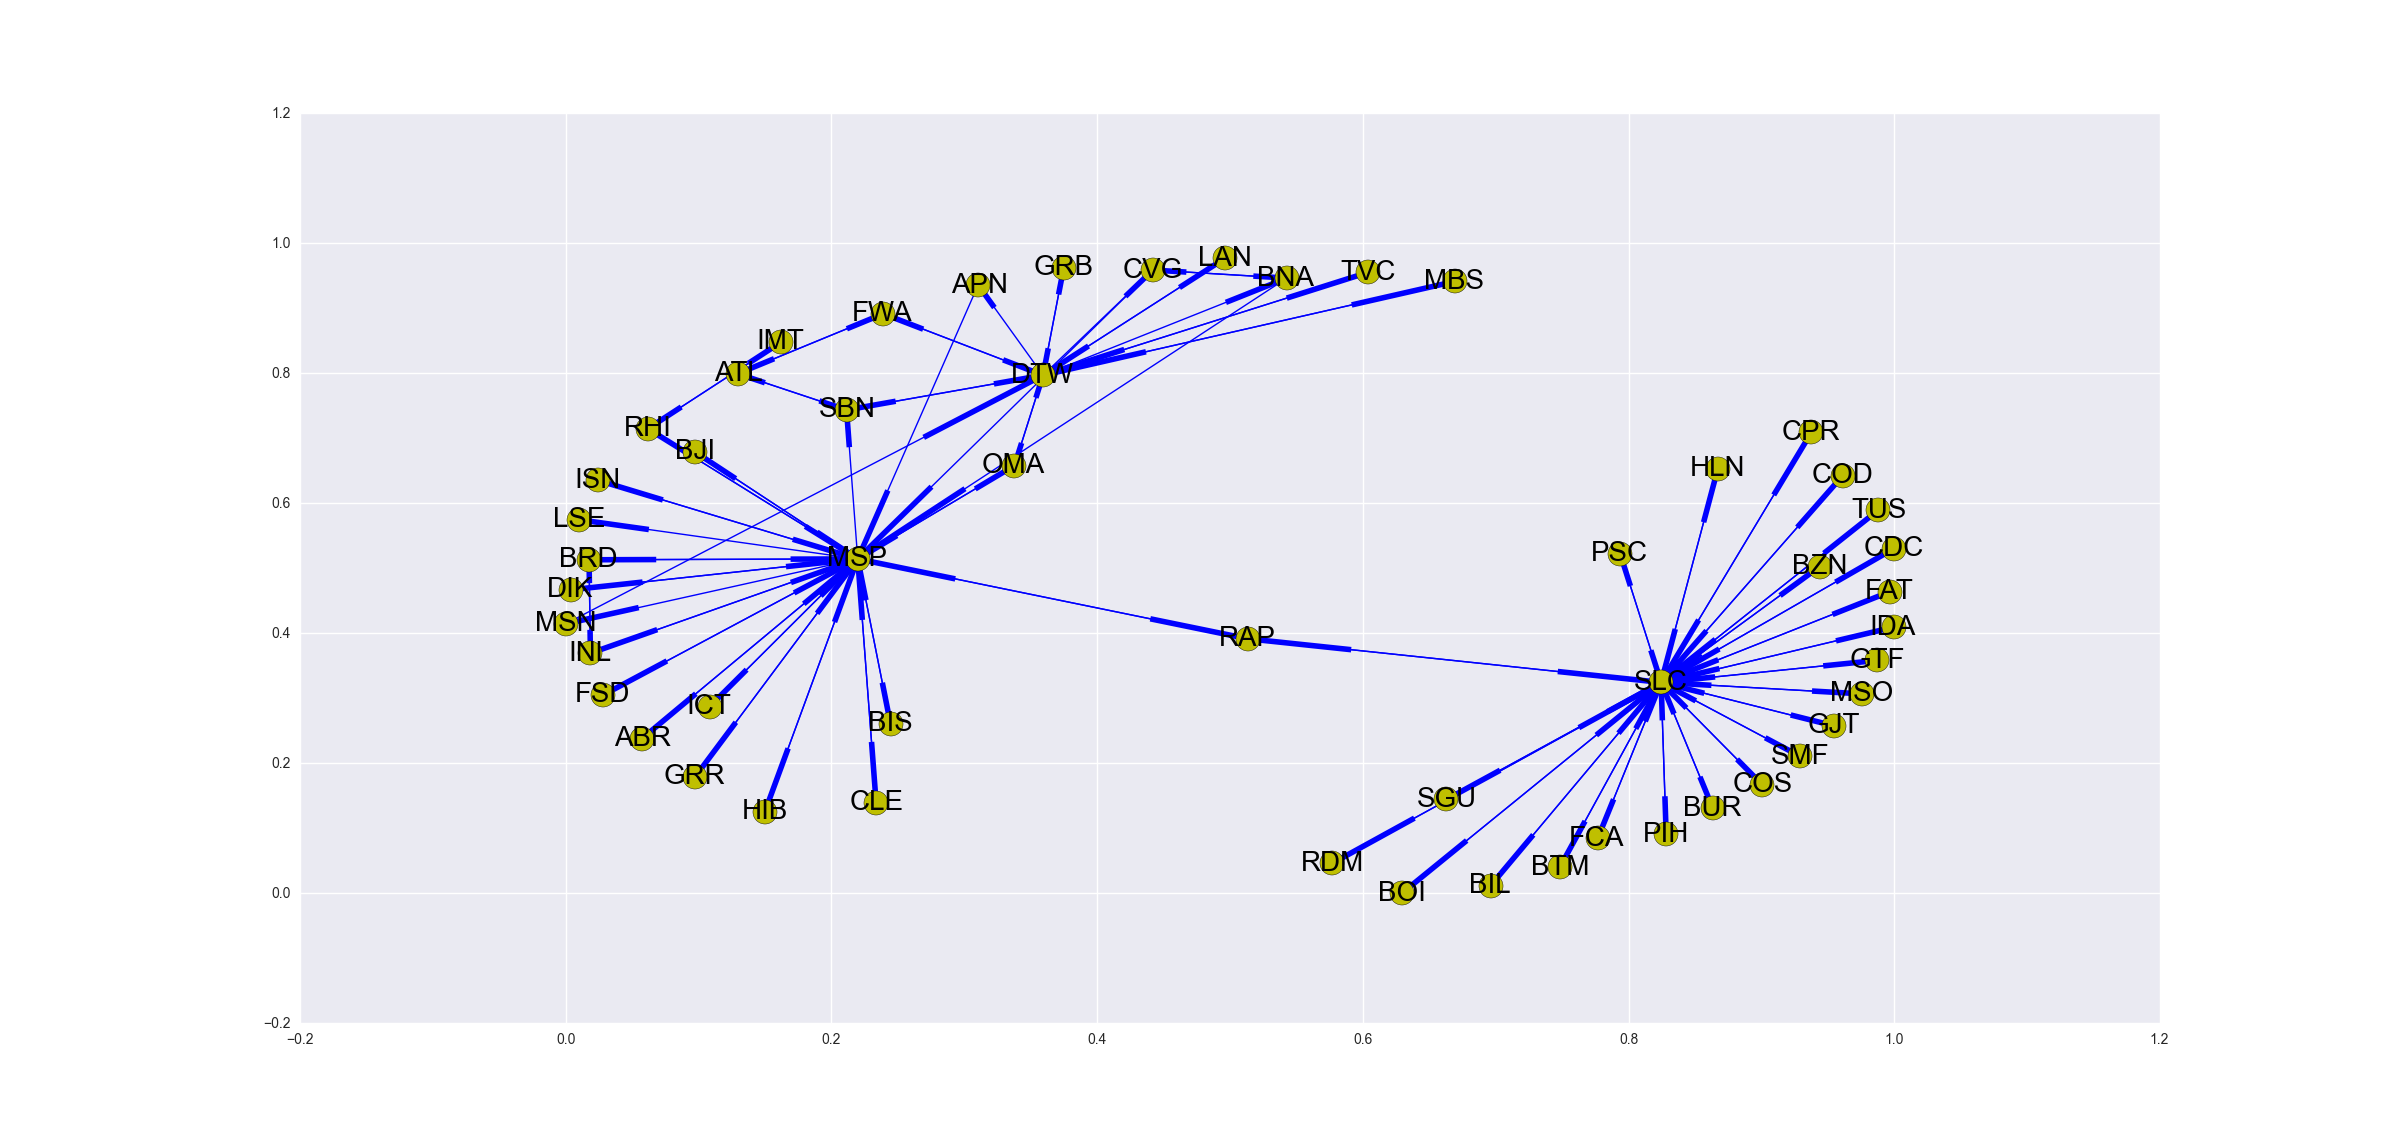
The most interesting find we had was that if we can track the physical plane (which is marked by a Tail Number) that will fly, we can achieve a 90%+ predictive power. This is because if a plane is late for his first flight, it will keep being late for the next flights because he has a small amount of time to refuel and continue to the next flight in each destination airport. This chain will only break once the plane had several hours of break in one of its’ destination airport. We tried to predict which tail number is going to be flying the flight, but we found out that it is a task we could not complete within the hackathon time frame. Planes fly to too many destinations and it requires a sophisticated algorithm to predict their location. For example, the airplane in the picture bellow has two main airports it flies to, and from each airport it flies to many other destinations.
1 comment
hi
I have tried reaching you both from the US as well as from Israel but haven’t heard back.
I am interested in the code behind the project to predict flight delays.
Please get back to me at [email protected] so we can discuss this matter further.
Thnx,
Gary Eiseb